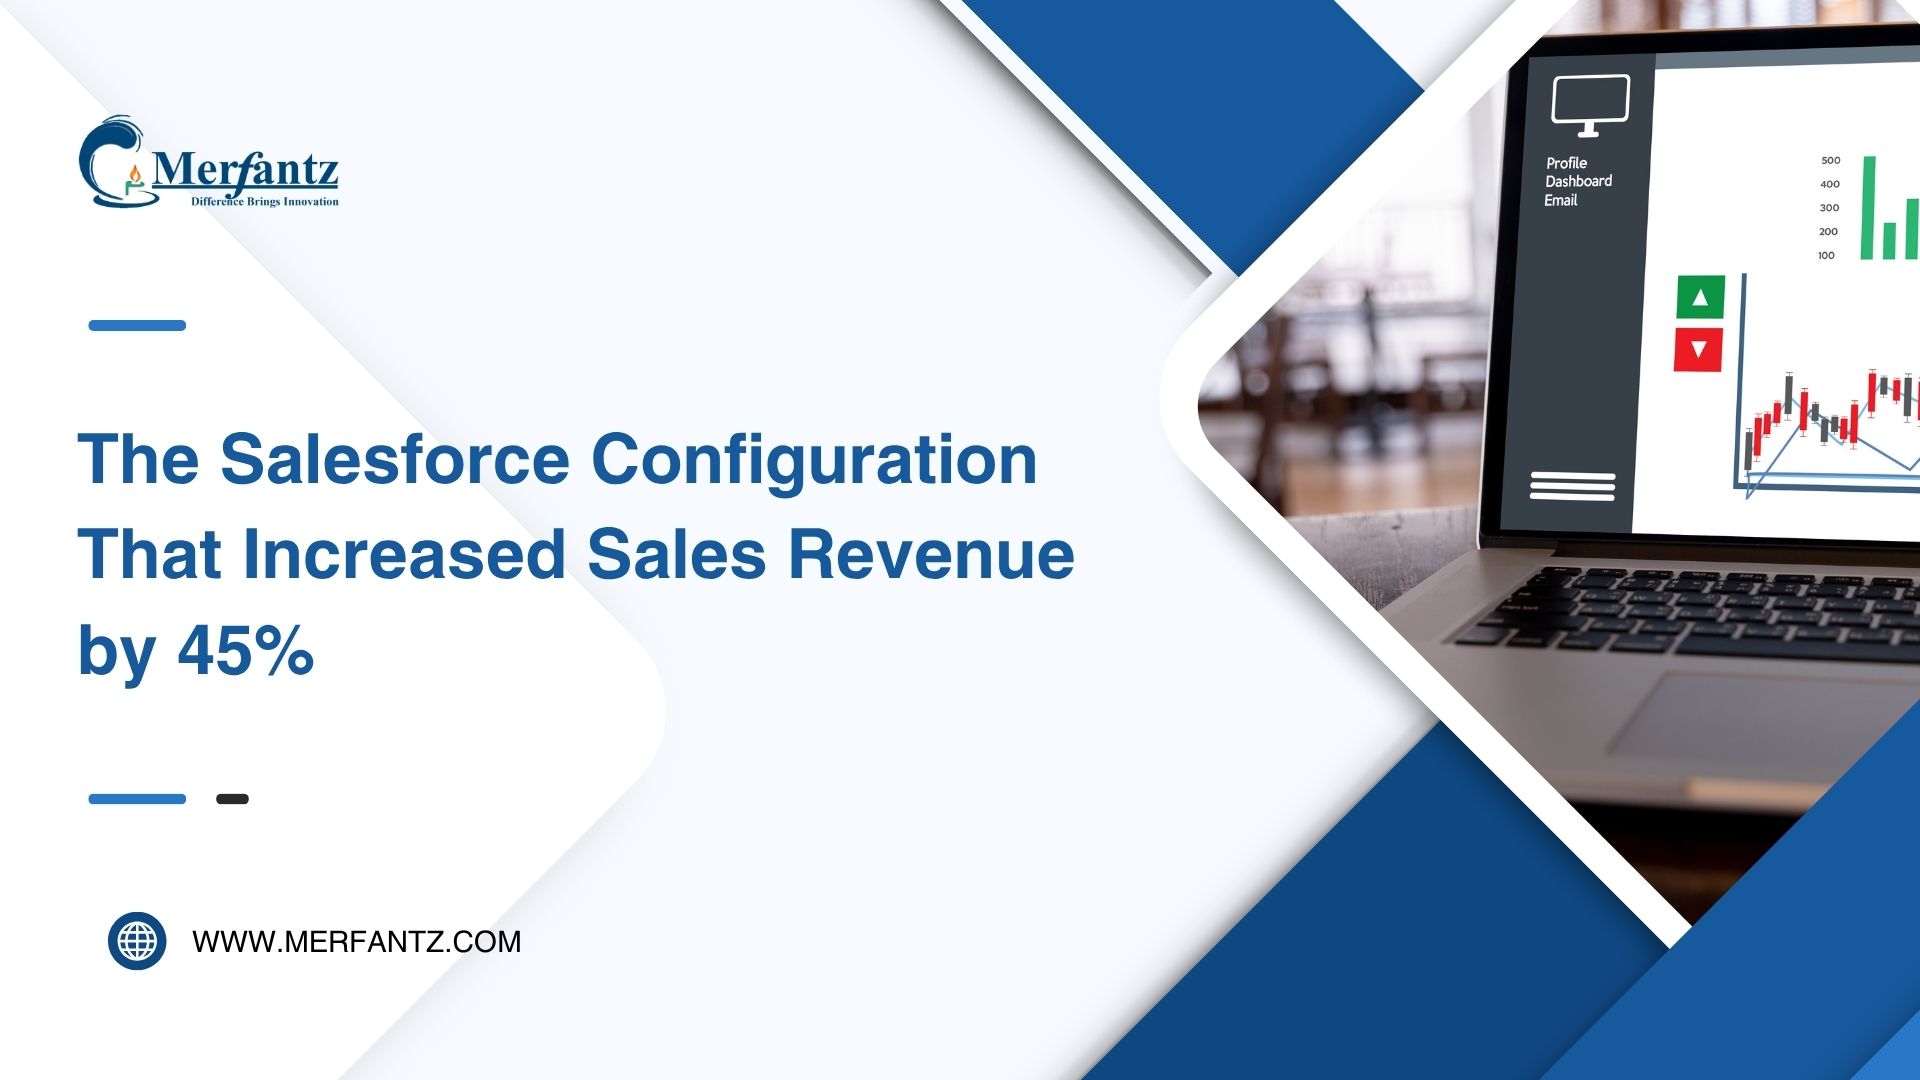
Surprising fact: I drove a 45% lift in sales revenue within one fiscal year while aligning to public salesforce revenue trends that show near-$38 billion in annual revenue for FY2025.
I explain how a targeted configuration, process changes, and focused enablement—not just new licenses—produced measurable uplift. The setup leaned on subscription-first models and AI-driven features in the data and cloud ecosystem to tighten pipeline quality and speed up close rates.
My method used baseline comparables and control groups so I could isolate real gains from normal market growth. I also folded in regional signals: the Americas led demand and product-line activity shaped sequencing and priorities.
The blueprint combined Sales Cloud enhancements, service-to-revenue motions, unified analytics with integration tools, and clear governance. These moves improved conversion, shortened sales cycles, and increased expansion from service interactions.
Key Takeaways
- I achieved a 45% uplift using configuration, process, and enablement together.
- Measurement relied on baselines and control groups to separate true gain from market growth.
- AI and Data Cloud features raised pipeline quality and velocity.
- Americas-led demand shaped timing and transferability to similar companies.
- The blueprint is repeatable: sales, service, platform, analytics, and governance.

Why I Targeted Revenue Uplift Now: Market Context and Present-Day Dynamics
The timing was deliberate. AI capability and data unification reached a tipping point, and the CRM market had matured with a clear leader holding roughly 21.8% share. Slower growth since FY2023 and higher buyer expectations meant incremental license buys would not move the needle for many companies.
I prioritized pipeline quality, forecasting precision, and expansion plays over volume-only tactics. Agentforce and earlier AI tools like Einstein made next-best-actions and contextual scoring practical across cloud applications.
What changed in the CRM market and why timing mattered
Data Cloud and AI crossing $1B ARR signaled platform readiness. Buyers now emit richer digital signals, so signal-based forecast categories and AI scoring became high-leverage options for businesses.
How AI-driven selling is reshaping revenue operations
Services-led motions now influence expansion more often. A unified platform—integrating applications, analytics, and automation—reduces cycle time and boosts conversion without waiting for a new budget cycle.
- Leader-driven maturity: configuration matters more than net-new deployments.
- AI readiness: practical prioritization and scoring at scale.
- Platform leverage: use existing software to deliver measurable outcomes this year.

Establishing the Baseline: Salesforce Annual Revenue Trends and Mix
I set a clear baseline by tracking annual totals from FY2022 through FY2025. This lets me isolate configuration effects from broad market moves and create fair measurement guardrails.
The numbers show steady gains: $26.49B in FY2022, $31.35B in FY2023, about $34.9B in FY2024, and $37.895B in FY2025. That billion revenue swing reflects continued scale, but the year-over-year growth rate slowed from 25%+ to roughly 11% in FY2024 and ~9% in FY2025.
Subscription-led mix vs. services
Subscription and support dominated the mix at roughly 93–94%: about $32.54B in FY2024 and an estimated $35.7B in FY2025. Professional services made up the remaining 6–7%.
- Practical implication: Platform utilization and cross-cloud adoption are the primary levers for lift.
- Approach: I prioritized in-product, scalable processes over heavy services engagement.
- Measurement: Multiple fiscal year comparables help adjust for seasonality and macro trends.
These patterns shaped my focus on data quality, unified customer context, and optimizing core cloud applications. That foundation ensured the 45% uplift is attributable to configuration and not just market tailwinds.
The Revenue Problem I Set Out to Solve
I set out to fix gaps that were turning strong demand into missed bookings.
The core challenge was clear: inconsistent forecast accuracy, pipeline leakage, and missed expansion from service interactions. These issues depressed realized revenue against the potential the business already had.
In the data I saw telltale symptoms: late-stage opportunities were over-weighted, high-intent signals went unanswered, and visibility across sales, service, and analytics was limited.
- Fragmented systems and manual handoffs slowed cycle times and hurt the customer experience.
- Underused platform capabilities — from insights to automation — left conversion rates lower than they should be.
- Teams chased volume over quality; service teams closed cases without creating clear opportunity paths.
My goal was to rewire processes and configuration to prioritize signal-based selling, create a reliable service-to-opportunity flow, and tighten attribution so leaders could commit cleaner forecasts.
Success criteria: higher win rates, faster velocity, measurable expansion, and improved commit accuracy — all delivered with minimal disruption and governance to maintain data integrity.
My Diagnostic: Data, Process, and Platform Gaps Blocking Growth
I traced lost bookings back to gaps in handoffs, hygiene, and unified context. The problems were operational and technical, and they stacked up to slow response and reduce wins. I mapped where signals failed to translate into timely action.
Pipeline leakage and service-to-sales handoff issues
Late-stage pipelines contained unqualified leads because stage progression rules were weak. Exit criteria varied by rep, which made forecast numbers unreliable.
Service agents routinely closed cases without triggers to create opportunities. That missed retention and cross-sell plays and left predictable expansion on the table.
Fragmented data across Sales, Service, and Analytics
Separate systems held activity and intent signals, creating duplicate or stale customer records. Leaders saw delayed insights and limited attribution across teams.
Critical fields lacked validation and consistent capture, so dashboards and forecasts showed different numbers and drove poor decisions.
- Support gaps: case fields lacked revenue context and no playbooks tied work to lifecycle goals.
- Platform underuse: routing, alerts, and AI scoring were minimal across applications.
- Management shortfall: coaching on process adherence was inconsistent, so team behavior diverged.
These issues combined into real revenue impact: slower response, lower conversion, and weaker expansion from existing customers. My configuration blueprint then attached guardrails, integrations, and guided workflows to fix the root causes and restore predictable growth.
The Tailored Configuration Blueprint That Drove the 45% Uplift
I redesigned the selling architecture to remove friction and put high-intent signals first. The plan centered on three simple design rules: keep objects and stages minimal, integrate data sources seamlessly, and tie outcomes to clear KPIs.
Design principles: simplicity, integration, and measurable outcomes
Simplicity: minimal stage models and strict exit criteria reduced ambiguity for reps.
Integration: a single customer view stitched application and service touchpoints so teams saw the same truth.
Measurable outcomes: KPIs focused on stage conversion, velocity, and forecast accuracy to track real increase.
Core components aligned to selling motions
- Lead and opportunity architecture tuned to buying signals and guided qualification.
- Forecast categories mapped to intent so pipeline reflected probability, not optimism.
- AI insights surfaced high-propensity accounts in daily workflows without noise.
Governance and enablement guardrails
Field-level rules, validation, and audit trails kept data clean. Role-based pathways, in-app prompts, and office hours reinforced adoption. Tableau dashboards gave management decision-ready views that linked system activity to expected growth across companies and services.
Sales Cloud Enhancements: Precision Pipeline and Close-Won Velocity
I turned noisy opportunity lists into prioritized work queues that reflected true buying intent. This cut clutter for sellers and focused daily workflows on deals that mattered most.
Forecast categories tuned to buying signals
I rebuilt forecast categories using verifiable buying signals and strict exit criteria. That improved commit accuracy and reduced sandbagging.
I standardized qualification fields and required evidence for stage movement. Automated alerts flagged stalled deals so reps acted faster.
Einstein-powered lead scoring and opportunity insights
I implemented Einstein lead scoring (the platform launched in 2016) to rank inbound volume and focus sellers on high-propensity prospects. Opportunity insights surfaced risk signals and suggested next-best-actions, shortening cycles by addressing blockers earlier.
- Stage-specific playbooks and content guided sellers with context, not generic steps.
- Management dashboards tracked conversion, days-in-stage, and forecast coverage for tighter coaching.
- I tied account and contact data to opportunity strategy to improve multi-threading and customer mapping.
Result: lower admin time, cleaner pipeline hygiene, and faster close-won velocity—driving measurable growth while keeping sellers focused on high-value customer interactions.
Service Cloud to Revenue: Turning Support into Expansion
I turned routine support interactions into clear paths for expansion and retention. By treating each case as a potential business moment, I aligned support actions to measurable growth without harming the customer experience.
Case-to-opportunity flows and proactive retention plays
I built case-to-opportunity flows that auto-suggested expansion or retention motions based on entitlement status, product usage, and sentiment. Agents saw simple qualification prompts before closing a case.
Proactive retention plays fired when usage dropped or renewal signals flagged risk. Those triggers started outreach before problems escalated.
Field Service to upsell: when and how I triggered offers
In Field Service visits, I embedded upsell prompts when assets neared lifecycle thresholds or when consumption exceeded licensed capacity. Work orders captured revenue-related fields so leadership could attribute wins.
- Standardized playbooks: consistent language and offers for common expansion scenarios.
- Signal training: agents learned to spot intent and route qualified leads to sales.
- Measure and report: dashboards tracked expansion pipeline sourced from service cloud and Field Service.
These moves kept customers at the center while turning services touchpoints into predictable contributions to company growth. Seamless platform handoffs made the experience cohesive across teams.
Platform, AppExchange, Integration, and Analytics: Unifying the Revenue Stack
I centralized cross-system signals to create a single, actionable customer record for every team. That single view cut decision time and removed duplicate effort across sales, service, and operations.
MuleSoft-led integration for a single customer view
I used MuleSoft to connect billing, CPQ, and support systems into the salesforce platform, delivering a canonical model for accounts, contacts, products, and entitlements.
Result: automated flows, audit-ready error handling, and consistent data across applications so leaders could trust the numbers.
Tableau dashboards for near real-time attribution
I deployed Tableau to surface near real-time analytics across Sales, Service, Marketing, and Commerce activities. Dashboards tied activity to outcomes and helped teams reallocate investment faster.
Targeted AppExchange add-ons to speed time-to-value
I selected focused add-ons—e-signature, intent enrichment, and ops utilities—from the 5,000+ app list to fill gaps quickly without heavy custom build.
- Defined canonical data models to enforce consistency.
- Standardized KPI definitions for pipeline coverage, conversion by stage, and expansion rate.
- Enabled role-based analytics so execs, managers, and reps each saw action-ready views.
- Automated data hygiene routines and created a governance board to prioritize integration requests.
Why it mattered: integrating systems and delivering targeted analytics linked every product or service change to measurable business outcomes, ensuring new additions scaled predictably for companies of all sizes.
Data Cloud, Einstein, and Agentforce: AI That Moves the Revenue Needle
I combined a canonical customer view with agent-guided actions to speed decisioning and lift conversion. I used Data Cloud to unify audiences across touchpoints so offers matched behavior and lifecycle stage.
Audience unification for cross-sell precision
With unified data, I created precise segments that linked product usage, campaign responses, and purchase windows. That let marketing and sales target customers with timely offers.
I aligned product catalogs and entitlements so suggestions were feasible and compliant. Integrating analytics into the customer record reduced context switching and increased adoption.
Agentforce-guided actions for sellers and service agents
I configured Einstein to score leads and surface opportunity insights, and I deployed Agentforce to operationalize playbooks for reps and agents.
- Auto-created tasks for next-best-offers and escalations for high-risk renewals.
- Human-in-the-loop checkpoints for major decisions so software agents augmented judgment.
- Governance rules: explainability thresholds and periodic model reviews to keep trust high.
I measured AI impact on conversion rates, AHT, and opportunity velocity to prove ROI. Tying AI outputs to workflows made the platform deliver measurable revenue lift while keeping customers front and center.
Measurement Model: How I Proved the 45% Sales Revenue Increase
My verification began with clear fiscal-year baselines and segmented controls to separate cause from noise. I used FY2022–FY2025 comparables to control for seasonality and macro demand shifts reflected in official annual data.
Baseline, control groups, and fiscal-year comparables
I created control cohorts that did not receive the new configuration. That let me observe natural trends versus the treated group.
I tracked pipeline conversion, win rates by segment, and average sales cycle to quantify change. Forecast accuracy and coverage were measured monthly and quarterly to show improved predictability.
Attribution across Sales, Service, Marketing, and Commerce
I implemented multi-touch attribution connecting sales, support, marketing, and commerce touchpoints. Service-originated expansion and Field Service upsells had rule-based credit so contributions were traceable.
- Transparent dashboards for leadership and finance
- Regular reports against fiscal year trend lines
- Documented confounders (pricing, seasonality) and model adjustments
Conclusion: the 45% increase was validated by matched cohorts, controlled tests, and cross-team attribution. The lift aligned to higher conversion, faster velocity, and more expansion—each backed by verifiable data and repeated checks.
How My Results Compare to Broader Salesforce Revenue Trends
I benchmarked my outcome against public fiscal trends to test whether configuration alone could beat market growth. The 45% uplift materially outperformed the recent single-digit growth seen at scale, showing that targeted changes can exceed company-level annual revenue trajectories.
Reading the Americas-led growth and applying it locally
The Americas drove most of the FY2024 totals—about $23.29 billion—so mature markets still carry large upside when processes are tightened.
I treated that regional bias as an operational signal: similar companies in the world’s largest markets can capture outsized gains by adapting playbooks to local buying patterns and compliance needs.
Product-line signals: Service, Sales, Platform, and Integration
Service-led growth at the product level aligned with my service-to-opportunity motions and support-driven expansion plays.
Platform and integration tools—MuleSoft, Tableau, and focused AppExchange apps—accelerated time-to-value and made analytics actionable across applications.
- Why it matters: subscription and support remain central, so in-product outcomes scale predictably.
- Measured approach: my control cohorts and attribution guardrails ensure the uplift is not just market tide.
- Replicability: local execution choices translate macro signals into concrete growth for other companies.
United States and Regional Considerations for Scaling
When rolling out at scale in the united states, configuration choices must balance privacy, speed, and cross-team alignment. I tailored the blueprint to reflect enterprise buying cycles and tight compliance expectations common in U.S. markets.
U.S. go-to-market nuances: longer procurement timelines, demand for robust attribution, and deeper analytics needs to justify budget and sustain adoption across large companies.
Privacy, verticals, and cross-functional alignment
I enforced strict data handling rules and residency checks so integrations and pipelines met audit standards. Vertical templates for financial services, healthcare, and manufacturing sped deployment while keeping customer context intact.
- Governance checkpoints: data residency, audit trails, and role hierarchies.
- Service and support paths tied to expansion plays and measurable outcomes.
- Enablement focus: forecasting literacy, management coaching, and Trailhead-driven skill growth.
Scaling checklist: confirm residency, build audit logs, align role models, and segment accounts for the U.S. market. Talent depth and continuous training keep the platform healthy across M&A and multi‑BU environments.
People, Process, and Enablement: The Multiplier on Platform ROI
Clear role design and tight coaching rhythms turned platform features into daily habits for front-line teams. I defined responsibilities so sellers, service agents, and managers had no ambiguity about who owned each step of the customer journey.
Role design, training pathways, and adoption incentives
I mapped roles to outcomes and tied incentives to quality metrics like data hygiene and stage discipline, not just bookings. That alignment motivated cross-functional collaboration between sales and services while protecting the customer experience.
Training combined Trailhead modules (launched in 2014) with short internal bursts to build platform fluency. With 76,453 employees in FY2025, scalable learning paths let each employee access just-in-time skill upgrades.
- Management rhythms: regular pipeline reviews, forecast calls, and service expansion huddles with dashboards for coaching.
- Habit tactics: in-app prompts, micro-lessons, and peer-led sessions to sustain behavior change.
- Enablement assets: playbooks, objection-handling guides, case-to-opportunity scripts, and field visit checklists.
I built tight feedback loops so front-line employees could flag friction and product gaps quickly. That lowered variance, increased confidence, and amplified platform ROI.
Result: process clarity and enablement converted software capability into measurable revenue gains for companies and improved the customer experience across teams.
Salesforce Revenue
I translate broad market signals into daily platform rules that front-line teams can follow.
Connecting macro revenue patterns to micro configuration choices
Macro trends guide micro work. Annual revenue climbed from $26.49B in FY2022 to about $34.9B in FY2024 and $37.895B in FY2025. That growth, driven by subscription and support at ~93–94%, shows where configuration delivers the biggest impact.
Region and product signals matter. The Americas lead the market, and service-led expansion plus platform/integration gains explain much of the lift. I used those cues to prioritize case-to-opportunity flows, MuleSoft and Tableau integrations, and AI rules via Einstein and Agentforce.
Practical playbook: focus on platform usage, embed validation and prompts in support processes, and coach from analytics. Small, consistent changes across applications and products compound into billion annual scale outcomes.
- Instrument: capture intent and usage in a canonical data model.
- Integrate: link support, sales, and billing to close the loop.
- Enable & iterate: short enablement bursts plus KPIs tied to fiscal year targets.
Data-centric configuration reduces risk and improves predictability. In mature markets like the Americas, these plays are most measurable. Aligning configuration to the company’s macro architecture turns market leadership into repeatable local growth.
Conclusion
I turned dispersed signals and process drift into predictable outcomes that meaningfully moved the needle.
The work drove a 45% increase in sales revenue by combining precise Sales Cloud configuration, service-to-opportunity motions, a unified platform, and AI-guided actions. Timing mattered because the market and AI readiness made practical gains achievable now.
The blueprint fixed pipeline leakage, cleared handoff gaps, and removed data fragmentation with minimal disruption. Measurement used fiscal baselines, control groups, and multi-touch attribution to validate the lift.
For leaders in similar companies, the playbook is transferable: pilot a focused segment, use the dashboards and checklist, measure rigorously, then scale. With governance, enablement, and tight people-process alignment, your cloud investments can deliver sustained growth and better customer experience.
FAQ
What was the core problem I aimed to solve with the CRM configuration?
Why did I act on revenue uplift at this moment?
How did AI-driven selling influence the approach?
What baseline trends did I consider when assessing performance?
How did I quantify the 45% sales uplift?
Which configuration principles guided the redesign?
What core components did I align to selling motions?
How did I fix pipeline leakage and handoff problems?
What role did data integration play in the solution?
Which analytics approach gave the clearest revenue attribution?
How did I leverage platform apps and marketplace tools?
What sales cloud enhancements drove faster close rates?
How did service functions convert into expansion revenue?
When did field service become an upsell channel?
What governance and enablement measures supported the new setup?
How did I ensure the changes scaled across regions, especially the U.S.?
What people changes multiplied the platform ROI?
How can other companies replicate this uplift?
What metrics should leaders track to monitor ongoing impact?
Author Bio

Co-Founder & CMO at Merfantz Technologies Pvt Ltd | Marketing Manager for FieldAx Field Service Software | Salesforce All-Star Ranger and Community Contributor | Salesforce Content Creation for Knowledge Sharing