
Enhance Your Dashboards with Image and Rich Text
Introduction
In the world of data visualization, effective dashboards play a crucial role in conveying complex information in a user-friendly manner. Visuals and rich text are powerful tools that can significantly enhance the impact and clarity of your dashboards. In this article, we will explore the importance of incorporating images and rich text and provide practical techniques to optimize their usage.then how to create an dashboard with images and rich text.
1: The Power of Visuals in Dashboards
1.1: Why Visuals Matter
Visual communication is an essential aspect of data visualization. Humans are inherently visual creatures, and visuals help us process and understand information more effectively. By leveraging the power of visuals, dashboards can simplify complex data sets, making them more accessible and understandable to a wide range of users.
When information is presented visually, it engages the audience’s attention and stimulates their cognitive processes. Visuals have the ability to convey a message or story quickly and intuitively, allowing users to grasp and interpret data with ease. This results in increased engagement and comprehension, ultimately leading to more meaningful insights and decision-making.
1.2: Choosing the Right Images
Incorporating images in your dashboard requires careful consideration to ensure that they align with the message you want to convey. Understanding your audience and the purpose of the dashboard is crucial in selecting relevant and impactful images. For example, if your dashboard focuses on financial data, using charts and graphs alongside relevant imagery such as currency symbols or stock market visuals can reinforce the context and aid understanding.
In addition to relevance, image quality is essential. High-resolution images that are clear and visually appealing enhance the overall aesthetic of the dashboard. Poor quality or inappropriate images can undermine the credibility of your data and distract users from the intended message. It is important to source images from reputable providers or create them yourself to ensure they are legally obtained and suitable for your content.
1.3: Incorporating Images in Dashboards
There are various ways to incorporate images into your dashboards effectively. Strategic placement of images can have a significant impact on user engagement. Placing visuals alongside relevant data or key insights can help reinforce the information being presented and create a stronger connection between the data and its interpretation.
Furthermore, finding a balance between images and other dashboard elements is crucial for maintaining a cohesive design. Images should complement the overall layout and not overpower or clutter the dashboard. By using images strategically, you can create a visually captivating dashboard that effectively communicates your data.
2: Enhancing Clarity with Rich Text
2.1: Utilizing Text Effectively
While visuals are powerful, text plays an equally important role in enhancing clarity in dashboards. Text can be used to emphasize key information, provide context, and guide users through the data. Selecting appropriate fonts and styles is crucial for readability. Fonts should be legible and easy on the eyes, ensuring that users can effortlessly read the content.
Text readability can be further enhanced by utilizing formatting techniques such as headings, subheadings, and bullet points. These techniques help organize information, making it easier for users to navigate and comprehend the dashboard. By emphasizing key words or phrases with bold, italics, or underline, you can draw attention to important insights and create a visual hierarchy within the text.
2.2: Structuring Text in Dashboards
Organizing text content in a logical manner is essential for maintaining clarity and coherence. Headers and subheadings provide a hierarchical structure, allowing users to quickly locate the information they need. Breaking down large chunks of text into smaller, digestible sections makes it easier for users to read and understand the content.
In addition to structuring, incorporating rich text features can further enhance the readability of your dashboard. Bullet points and numbered lists can effectively present information in a concise and visually appealing manner, facilitating comprehension. Hyperlinking relevant keywords or phrases to additional information or context provides users with an opportunity to explore further, making your dashboard more comprehensive and user-friendly.
2.3: Incorporating Rich Text Features
To make your text even more engaging, utilizing features like bold, italics, and underline selectively can help highlight important words or phrases. When used in moderation, these formatting tools can draw attention to key insights or significant data points, guiding users towards the most relevant information.
Moreover, the use of bullet points and numbered lists allows for clear and concise presentation of information. Complex concepts can be broken down into smaller, easily digestible pieces, aiding understanding and improving the overall user experience. Additionally, hyperlinking provides users with a seamless way to access additional context or related resources, enhancing the depth of information available within your dashboard.
3: Best Practices for Designing Image-rich Dashboards
3.1: Maintaining Consistency and Simplicity
To create visually appealing and user-friendly dashboards, it is crucial to establish a consistent visual language. Consistency in design elements such as color palette, typography, and iconography helps create a cohesive experience for users, reducing cognitive load and enhancing overall comprehension. By maintaining a clean design, free from clutter and unnecessary elements, you ensure that users can focus on the core message of the dashboard without distraction.
Balancing the use of images with other dashboard components is also important. While images can enhance the visual appeal, they should not overshadow or overwhelm other elements. A harmonious balance between visuals, text, and interactive components ensures that the dashboard remains user-friendly and guides users towards relevant insights.
3.2: Optimizing Image Sizes and Formats
Optimizing image sizes and formats is crucial for maintaining dashboard performance. Large image files can slow down the loading time of your dashboard, leading to a poor user experience. Compressing images and reducing file sizes without compromising quality can significantly improve performance and ensure swift data visualization.
Choosing suitable image formats for web-based dashboards is equally important. JPEG and PNG formats are commonly used due to their compatibility and ability to preserve visual quality. Additionally, resizing of images to fit within the dashboard should be done carefully to avoid distortion or loss of clarity. By optimizing image sizes and formats, you can ensure that your visuals retain their integrity and provide a seamless experience for users.
4: How do create enhanced dashboard with image and rich text(For Example)
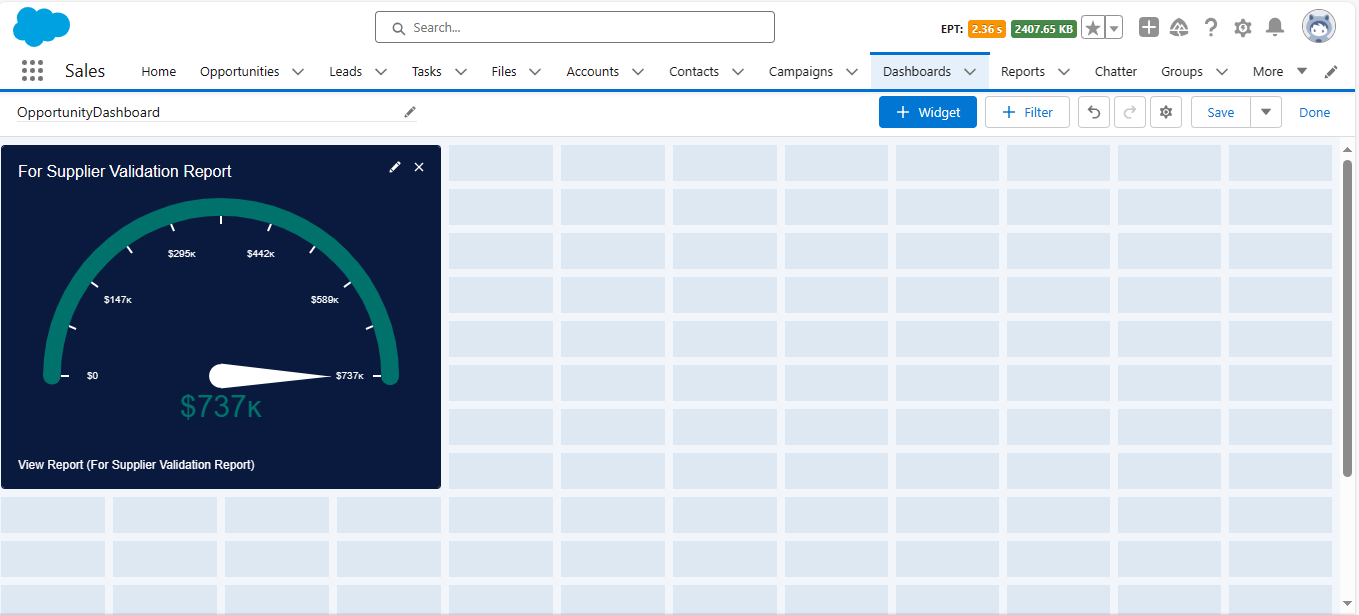
4.1: Go to dashboard create new dashboard place your report,which you want to present to your audience.
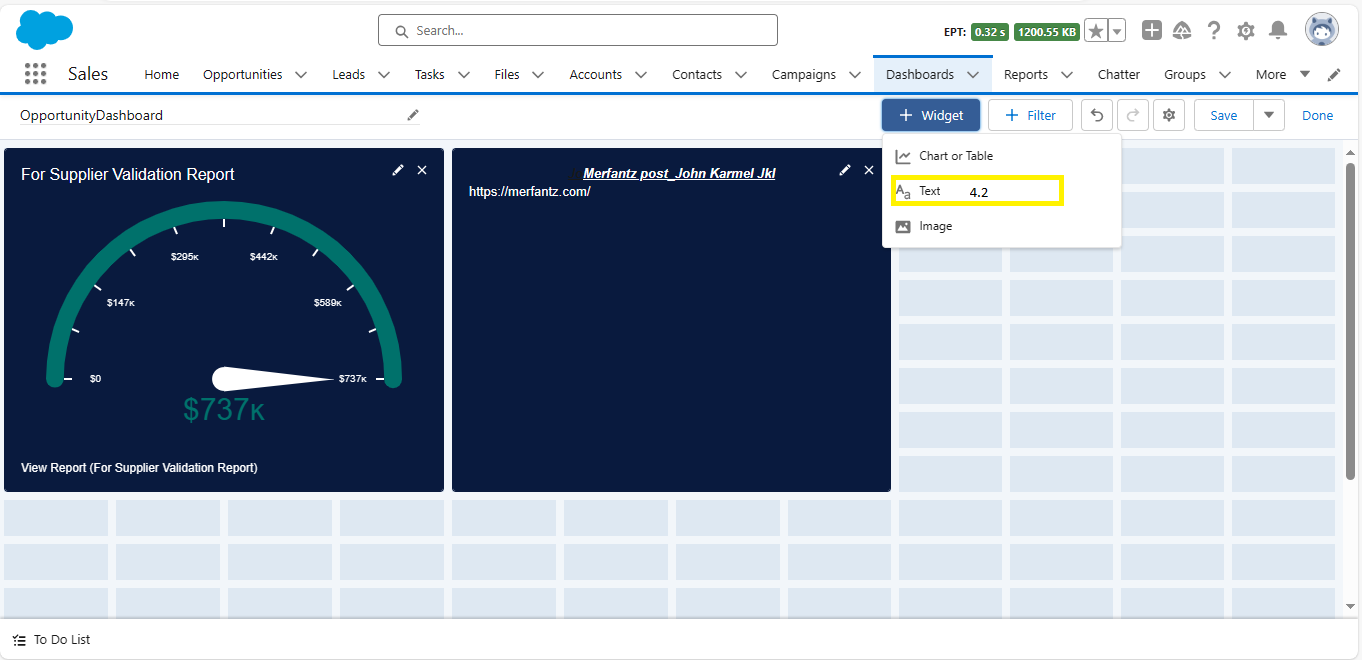
4.2: Here,Click on widget,then click on text,here play with your own thoughts.
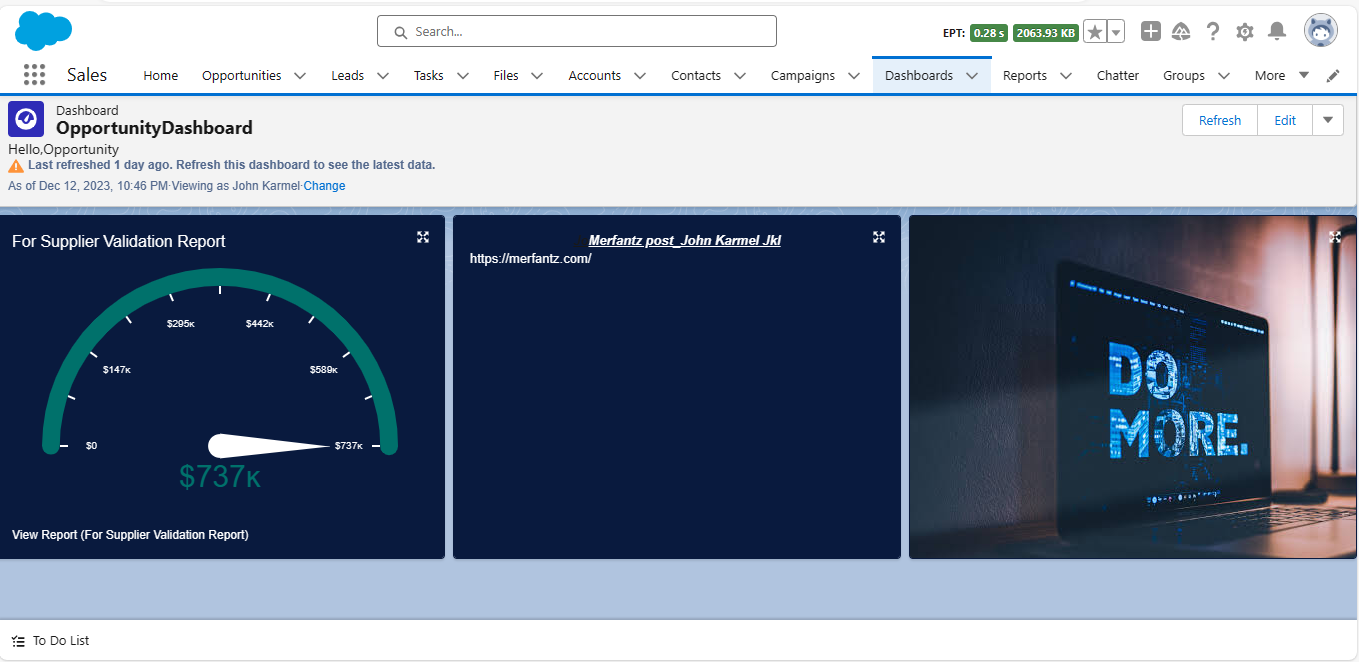
4.3: Again,Click on widget,then click on image,here place your images relevant to your report.

4.4: Now successfully created an dashboard with image and rich text.
In conclusion, the inclusion of images and rich text in your dashboards can greatly enhance their effectiveness in data visualization. Visuals engage users, simplify complex information, and improve understanding. Selecting high-quality and relevant images, along with strategically placing them, ensures that they complement the dashboard’s message and create a visually captivating experience.
Rich text features such as appropriate font choices, formatting techniques, and hyperlinks enhance clarity and guide users through the data. Balancing the use of images and maintaining consistency in design elements create a user-friendly dashboard that supports effective communication. Finally, optimizing image sizes and formats ensures optimal performance, allowing users to seamlessly interact with and interpret the data.
By following the strategies and best practices outlined in this article, you can transform your dashboards into visually engaging and informative tools that effectively communicate data to your audience.
FAQs (Frequently Asked Questions)
- How do I determine which images are most suitable for my dashboard?
> When selecting images for your dashboard, consider the relevance to your message and the audience’s context. Understand the purpose of the dashboard and choose visuals that align with your intended narrative.
- What are some common mistakes to avoid when incorporating images in dashboards?
> Avoid using low-quality or irrelevant images that can diminish the credibility of your data. Also, be mindful of the size and placement of images, ensuring they enhance the overall design and do not overpower other dashboard elements.
- How can I ensure my text remains readable in different screen resolutions?
> To ensure text readability across various screen resolutions, choose fonts that are legible at different sizes. Test the readability of your text on different devices and adjust font sizes accordingly. Avoid using font sizes that are too small or too large, as they can hinder legibility.
- What techniques can I use to maintain a clean and user-friendly design while incorporating rich text features?
> To maintain a clean and user-friendly design, use formatting elements such as headings, subheadings, and bullet points to organize the text. Avoid overcrowding the dashboard with excessive text or too many rich text features. Prioritize clarity and simplicity in your design choices.
By adopting these techniques and addressing these frequently asked questions, you can create visually appealing and informative dashboards that effectively communicate data to your audience. Happy dashboard designing!.