
3 min read
Overview
Salesforce FieldAx provides Dashboards and Reports to help the team monitor customer activity, sales performance, service operations, parts usage, and financial performance.
A Dashboard brings multiple reports together on one page to provide a visual summary of the data. The available dashboards are:
- Customer Service & Account Analytics Dashboard
- Quote & Sales Performance Dashboard
- Job & Service Operations Dashboard
- Parts Demand & Operational Reporting Dashboard
- Invoice & Financial Analytics Dashboard
1. Navigating Reports & Dashboards
Open a Dashboard or Report
- Open the Dashboards tab to view the available dashboards.
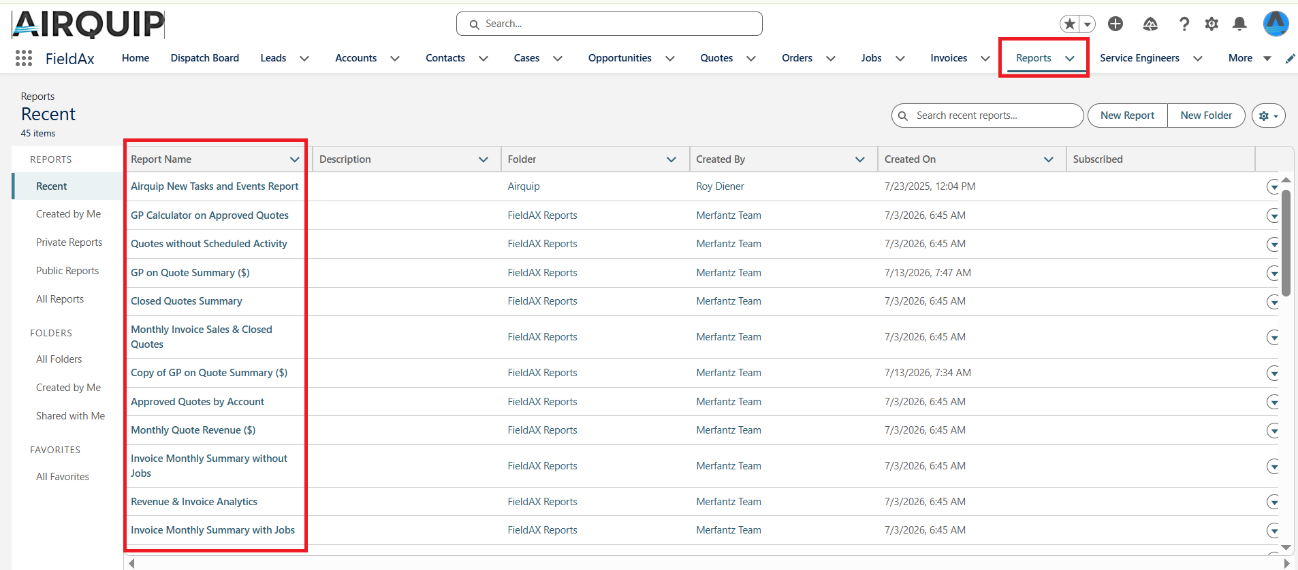
- Open the Reports tab to view the available reports.
- Select the Dashboard or Report you want to view.
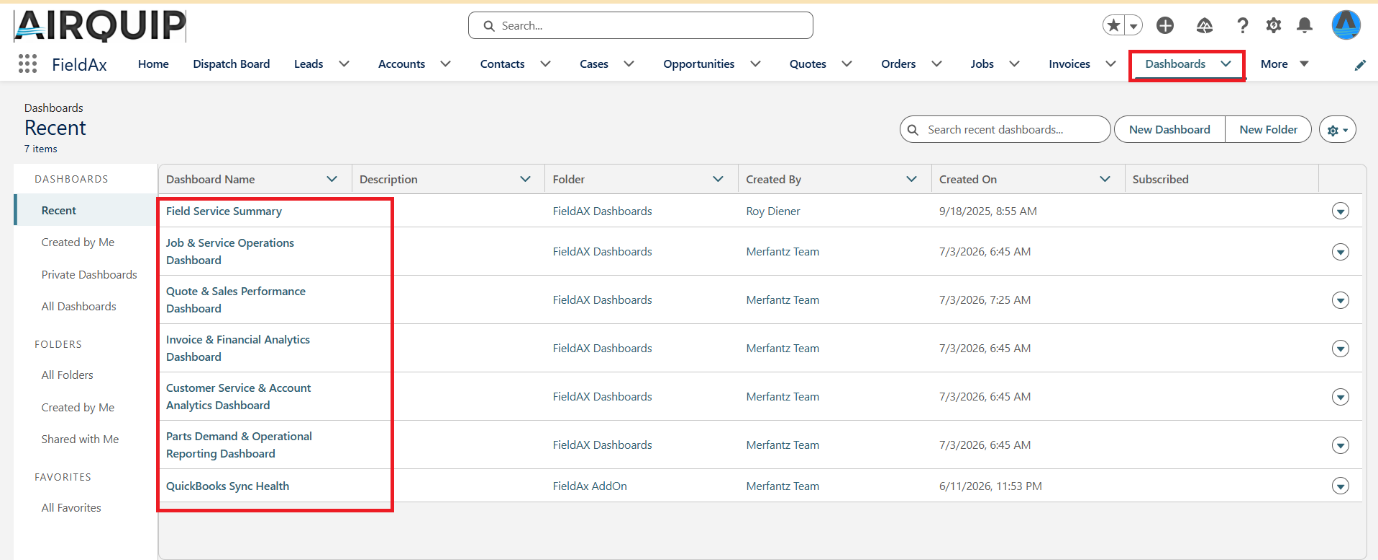
Available Dashboards and Reports.
Refresh or Edit
Use the Refresh button to update the displayed information.
Use Edit when you need to modify the Dashboard.
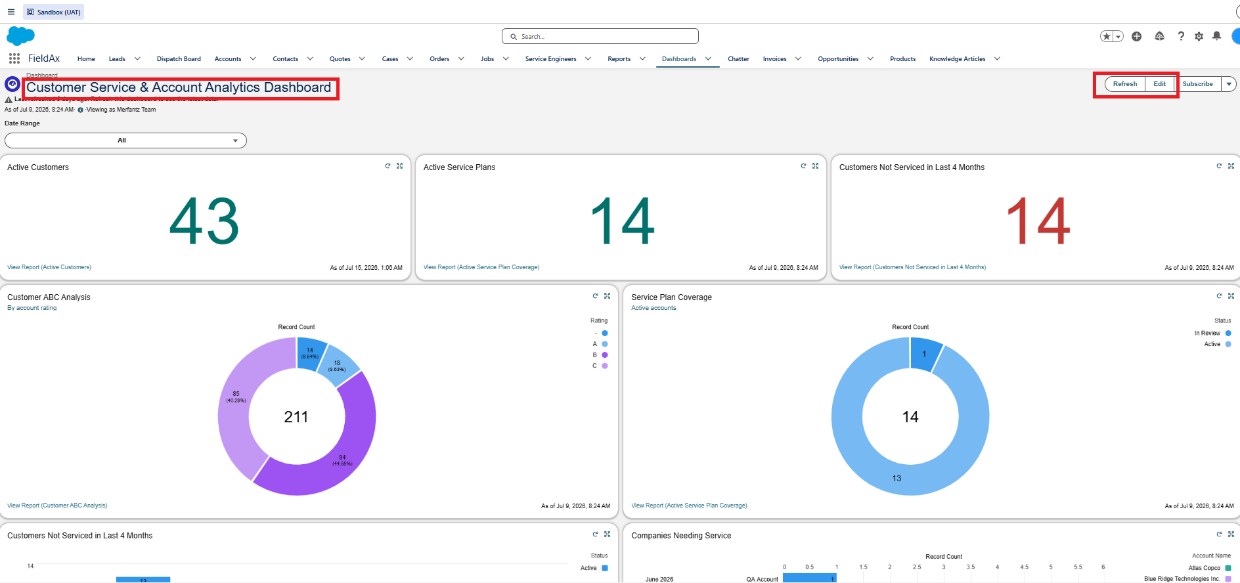
Refresh and Edit options.
Filter by Date Range
Use the Date Range filter to view information for a specific period.
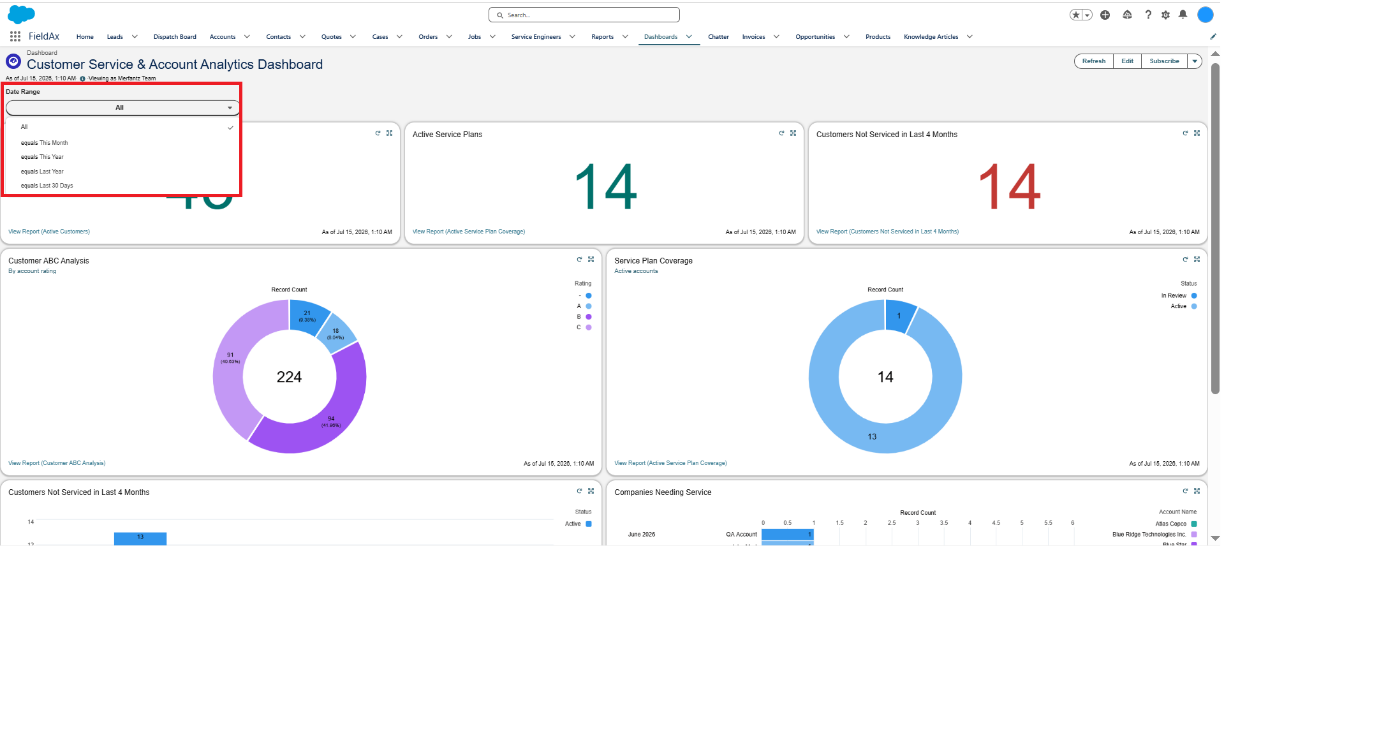
Dashboard Date Range filter.
More Options
Use the dropdown menu in the top-right corner for additional options:
- Download
- Save As
- Change Owner
- Delete
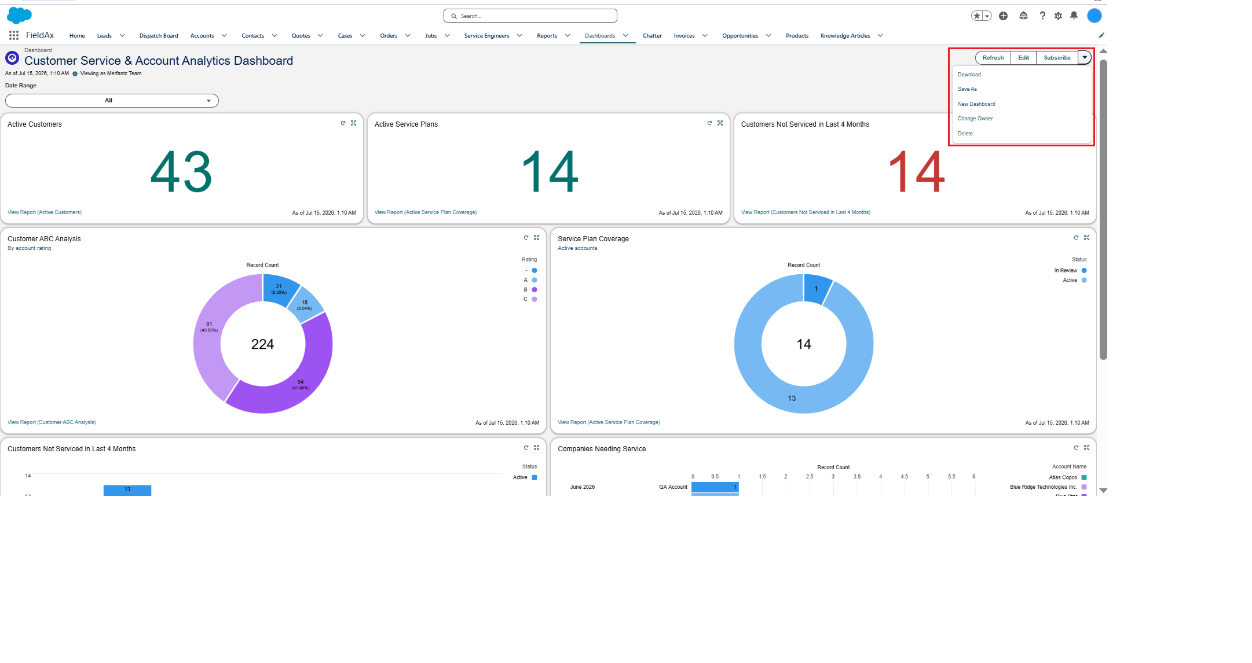
Dashboard More Options menu.
2. Customer Service & Account Analytics Dashboard
This Dashboard provides an overview of customer relationships and service contract activity.
It includes:
- Active Customers – Customers currently doing business with Airquip.
- Active Service Plans – Customers with active maintenance or service agreements.
- Customers Not Serviced in Last 4 Months – Customers who may need a follow-up visit.
- Customer ABC Analysis – Groups customers into A (high), B (medium), and C (low) value.
- Service Plan Coverage – Compares active service plans with plans still under review.
- Customers Not Serviced – Visual view of accounts requiring follow-up.
- Companies Needing Service – Highlights companies that may require a service visit.
Why it matters: Helps the team maintain customer relationships and identify new service opportunities.
Click View Report on any section to open the detailed report behind the dashboard.
Customer Service & Account Analytics Dashboard.
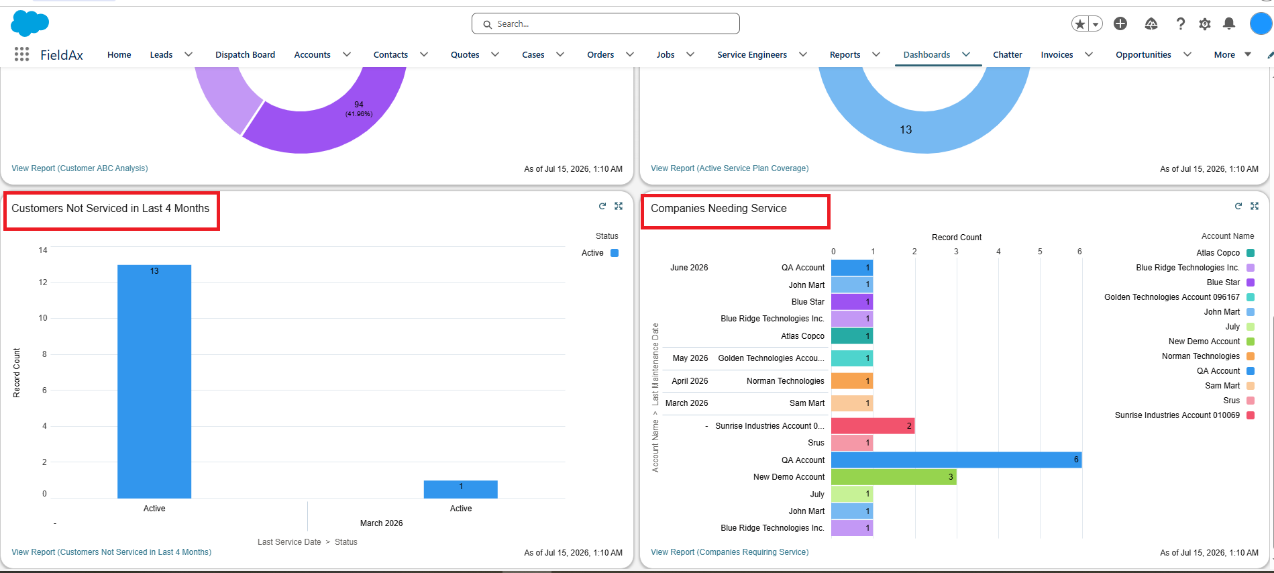
Chart highlighting companies that may need service.
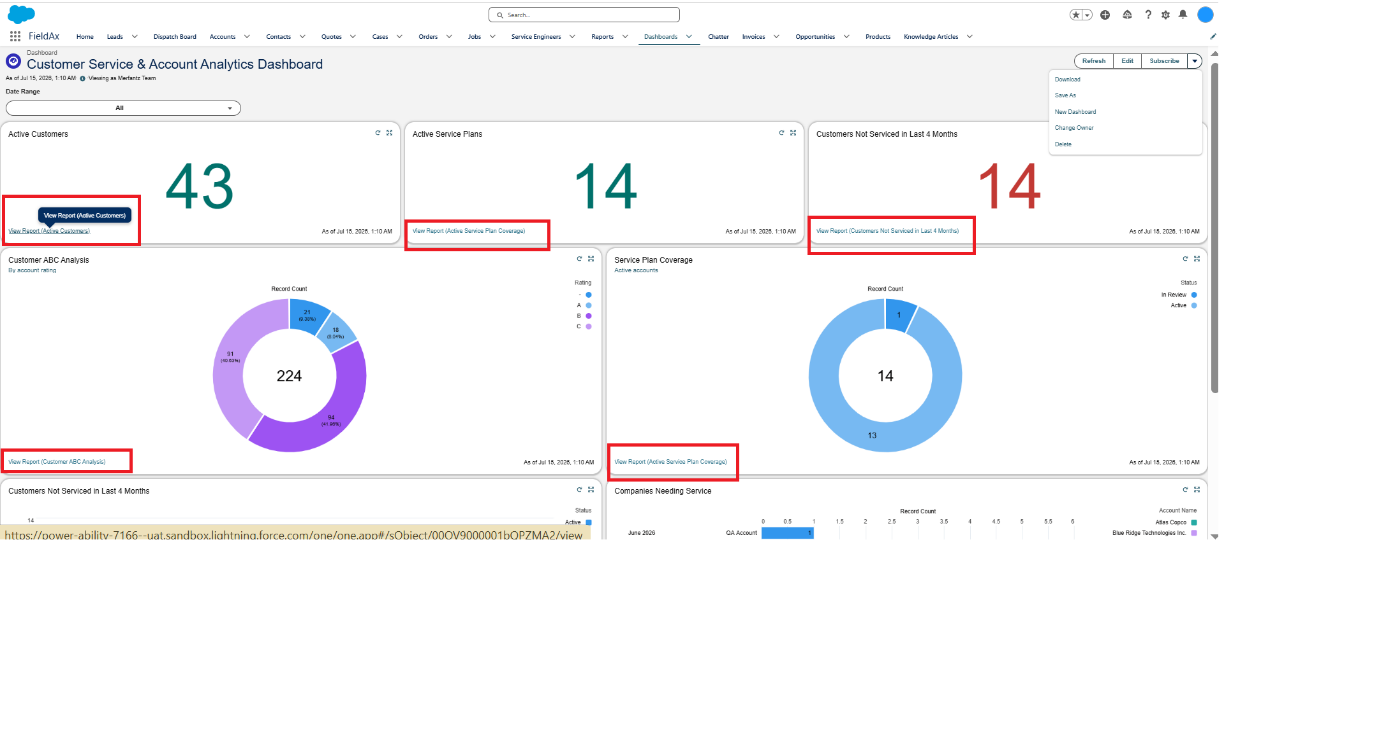
Full report view, opened using View Report
3. Quote & Sales Performance Dashboard
This Dashboard provides an overview of sales performance, revenue, profitability, and top customers.
It includes:
- Total Quote Gross Profit ($) – Combined profit from quotes.
- Average Gross Margin (%) – Average profit percentage after costs.
- Monthly Invoice Sales & Closed Quotes – Monthly sales performance.
- Monthly Quote Revenue – Value of quotes created each month.
- Approved Quotes by Account – Customers approving the most quotes.
- Quote Summary Grand Total – Total quote value by month.
- Top Profitable Quotes – Quotes generating the highest profit.
- Quotes without Scheduled Activity – Quotes that have not yet been scheduled.
- Closed Quotes Summary – Summary of closed quotes.
Why it matters: Helps the team understand how much business is being won, profitability, and which customers contribute most to revenue.
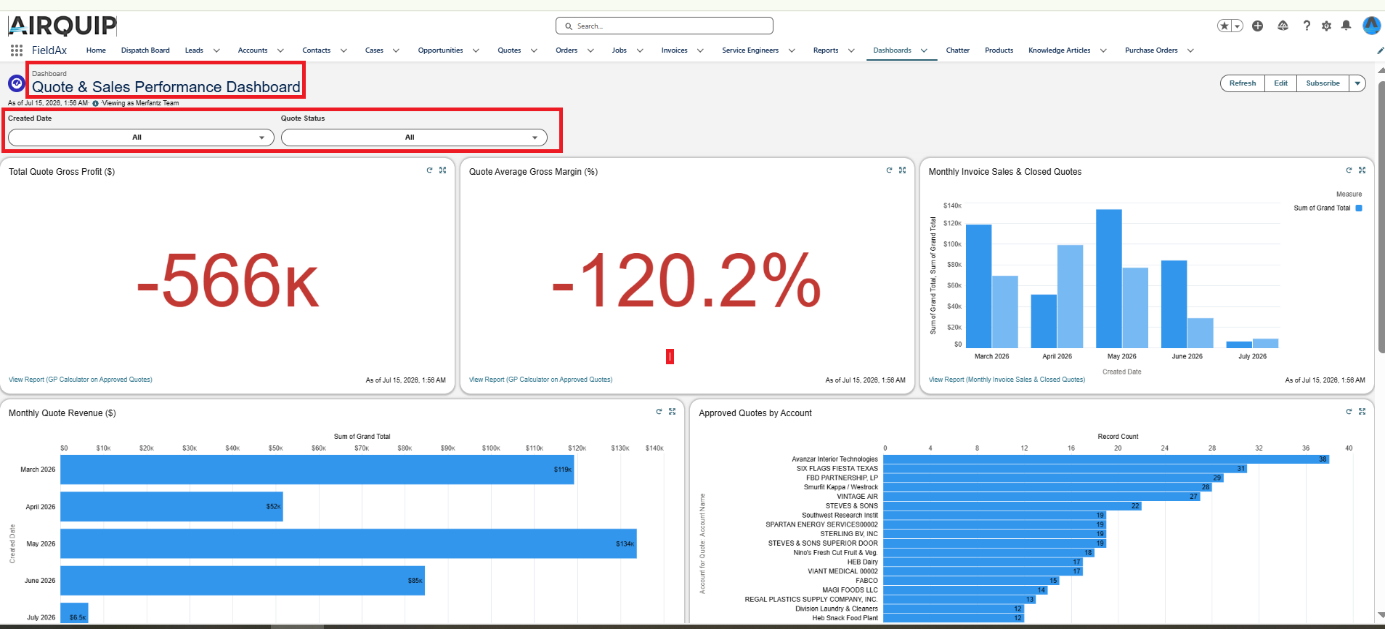
Quote & Sales Performance Dashboard overview.
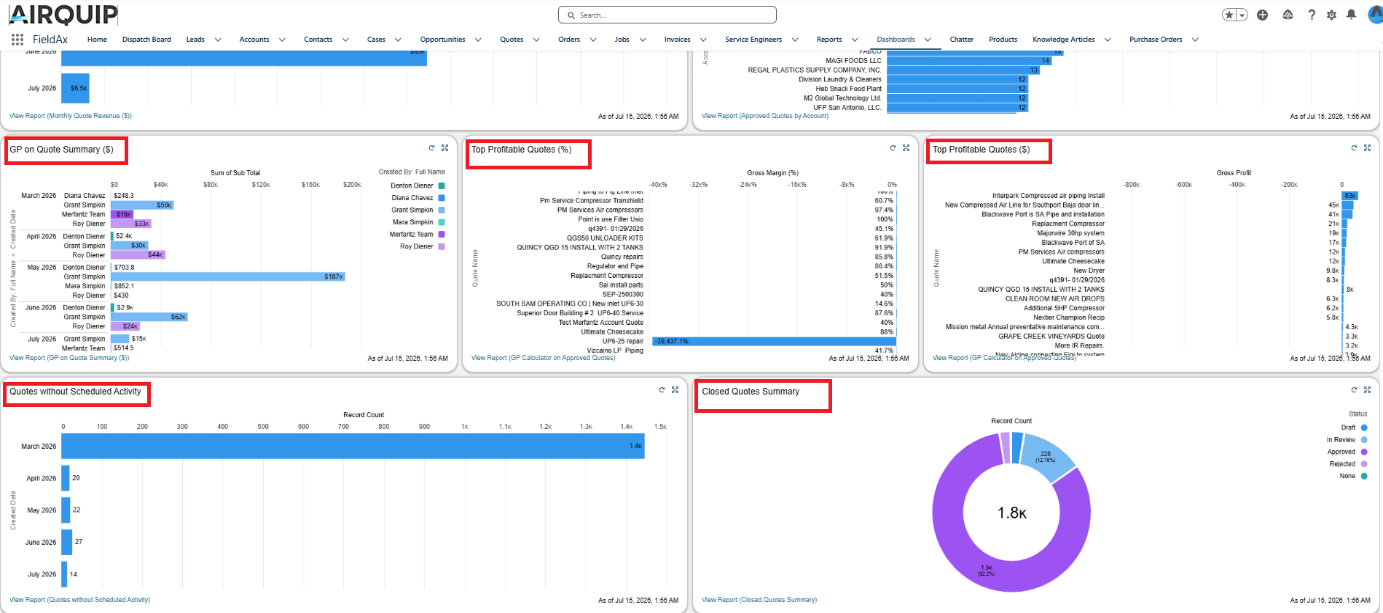
Quote & Sales Performance Dashboard.
4. Job & Service Operations Dashboard
This Dashboard provides a quick view of service jobs, technician performance, work hours, travel time, and labor costs.
It includes:
- Total Active Jobs – Jobs currently open or in progress.
- Total Work Hours – Hours technicians have spent working on Jobs.
- Total Labor Cost – Labor cost for completed work.
- Total Completed Jobs – Successfully completed Jobs.
- Technician Labor Hours – Hours logged by each technician.
- Technician Travel Hours – Time spent travelling to customer sites.
- Technician Productivity (Job Hours by Month) – Work completed by each technician by month.
- Job Cost by Technician – Labor cost generated by each technician.
- Time, Travel and Work per Job – Comparison of work, travel, and other activity time.
Using This Dashboard
The Dashboard helps you:
- Monitor active and completed Jobs
- Track technician productivity
- Measure labor and travel time
- Control service costs
- Balance technician workloads
- Improve scheduling efficiency
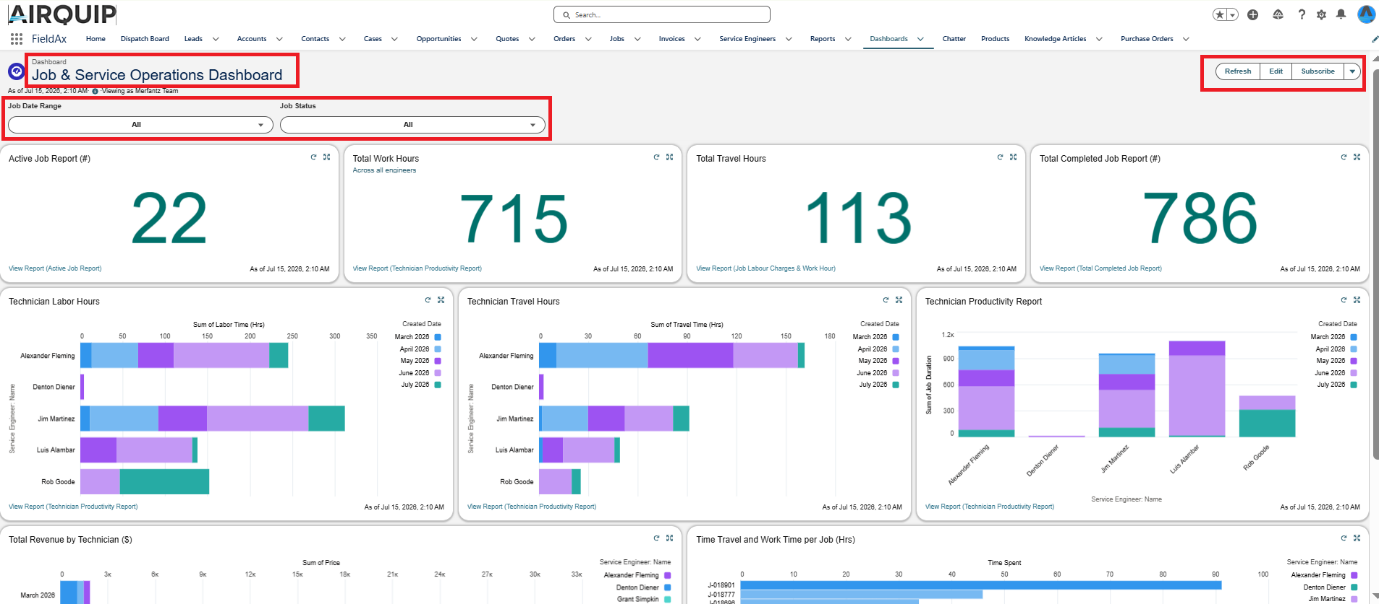
Job & Service Operations Dashboard.
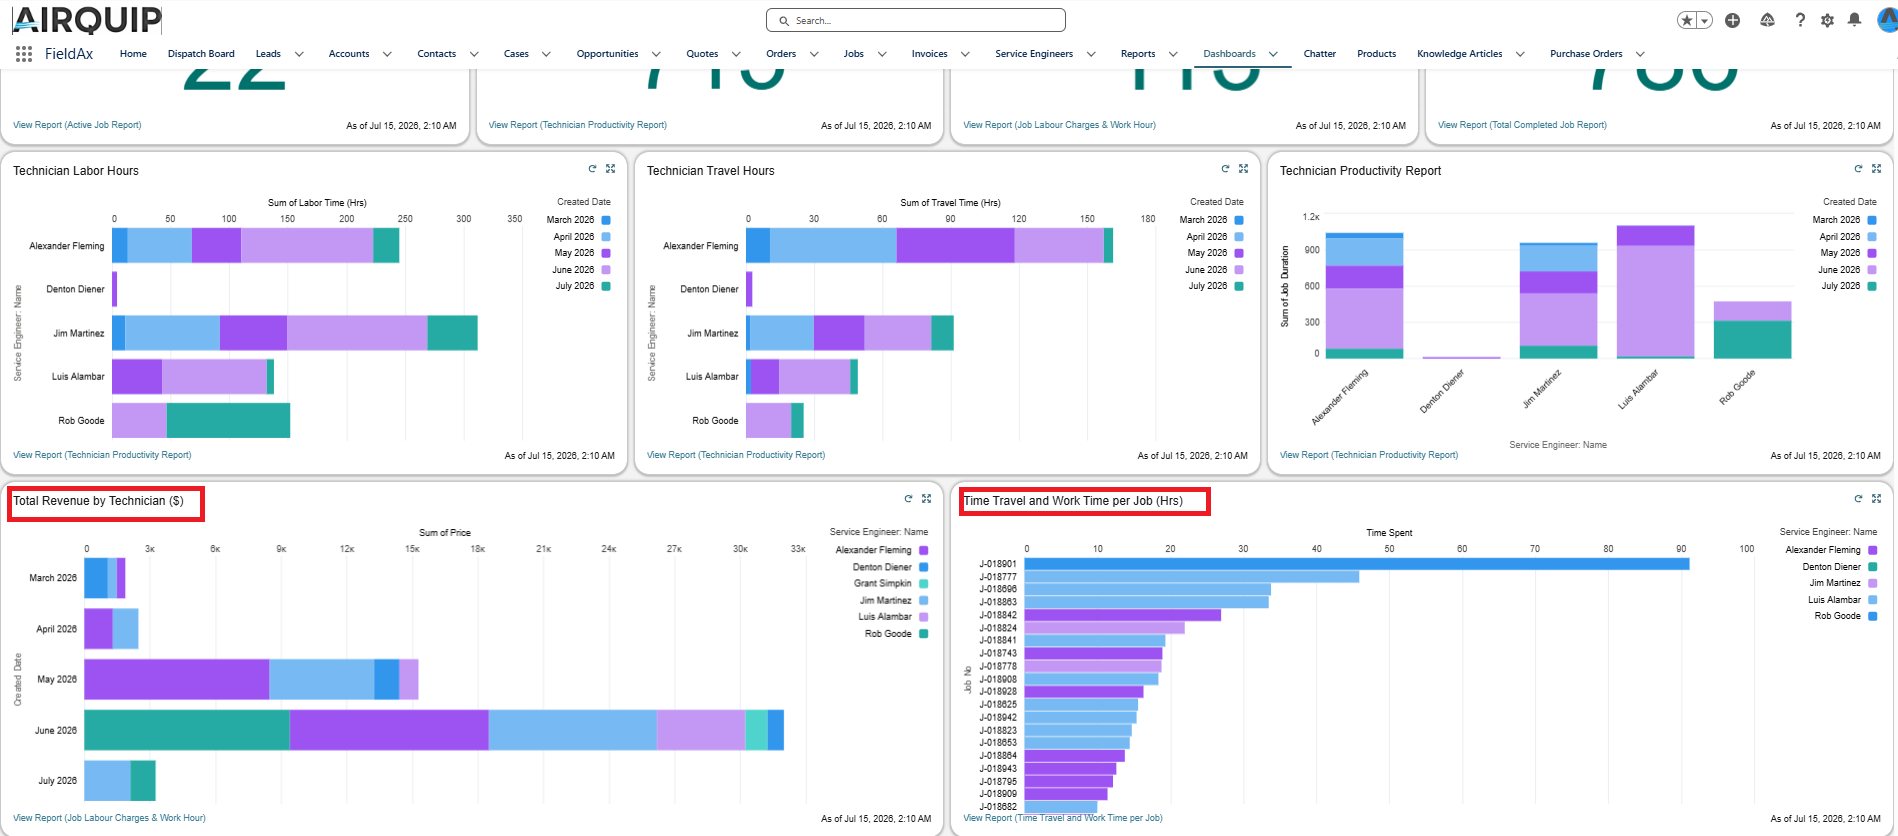
5. Parts Demand & Operational Reporting Dashboard
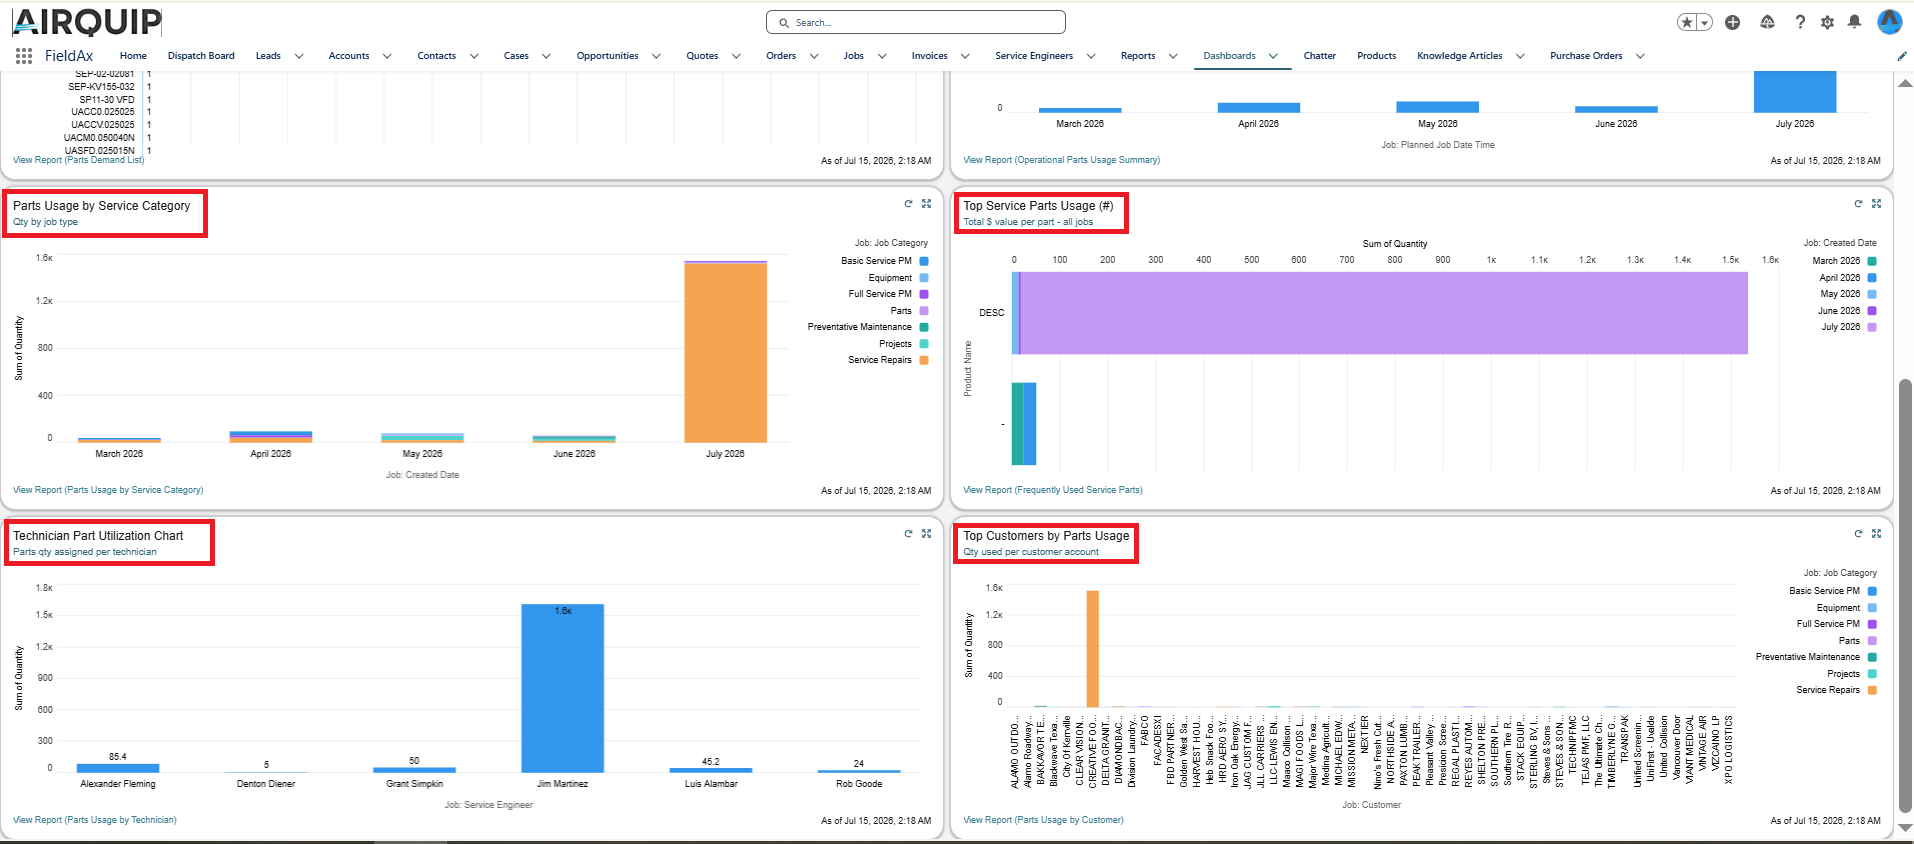
This Dashboard shows parts usage, parts spending, and service team utilization.
It includes:
- Total Parts Used – Parts used during the selected period.
- Spend – Total amount spent on parts.
- Active Service Engineers – Engineers actively working on Jobs.
- Demand List – Frequently used parts to help manage stock.
- Monthly Parts Consumption Trend – Parts usage month by month.
- Parts Usage by Service Category – Parts used by different service categories.
- Top Service Parts Usage – Parts used most often or costing the most.
- Technician Utilization – Parts usage by technician.
- Top Customers by Parts Usage – Customers generating the highest parts demand.
Why it matters: Helps reduce stock shortages, control parts costs, and maintain the required inventory.
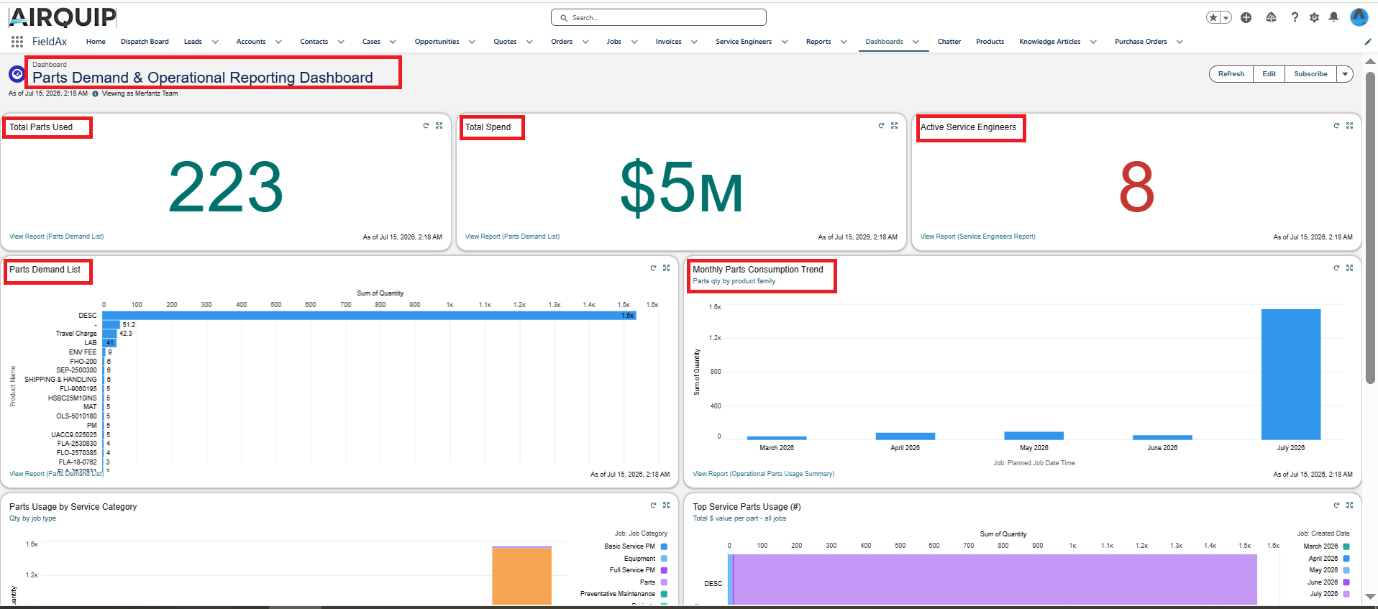
Parts Demand & Operational Reporting Dashboard.
6. Invoice & Financial Analytics Dashboard
This Dashboard provides an overview of revenue, profitability, and invoice trends.
It includes:
- Total Revenue – Revenue from all invoices.
- Average GP Margin – Average profit after direct service costs.
- Active Customers – Customers currently doing business with Airquip.
- Revenue by Customer – Revenue generated by each customer.
- GP Per Invoice (%) – Profit margin for individual invoices.
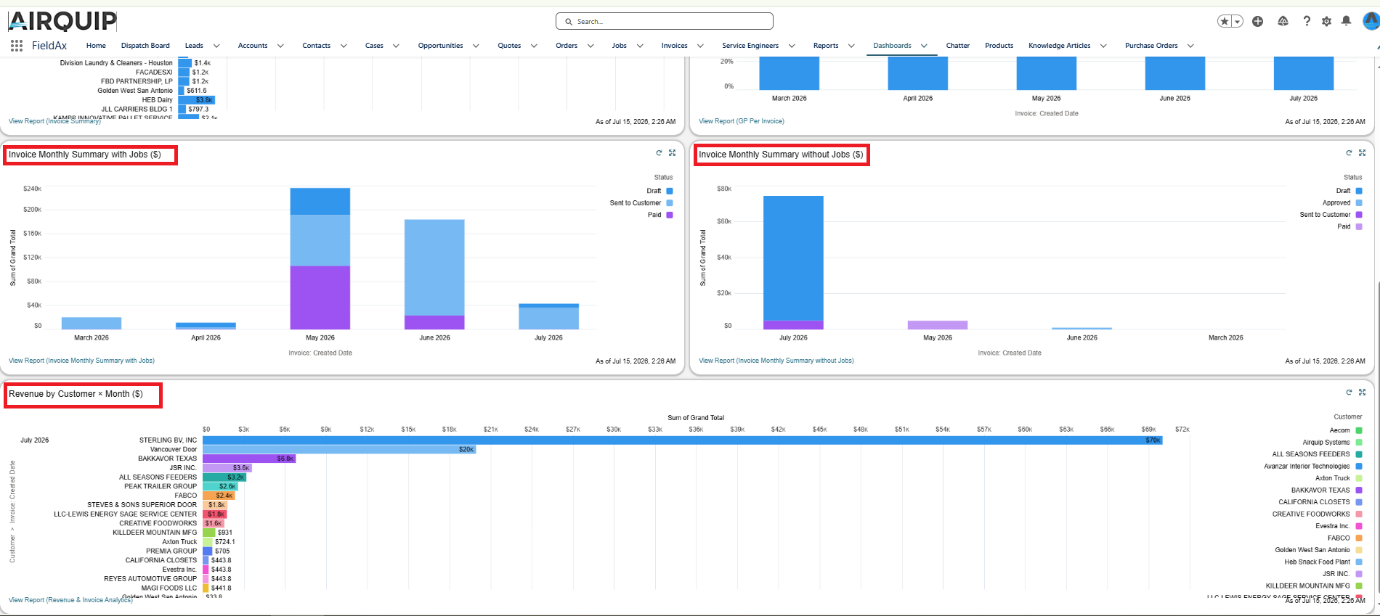
- Invoice Monthly Summary with Jobs – Monthly invoice revenue linked to service Jobs.
- Invoice Monthly Summary without Jobs – Revenue from invoices not linked to Jobs, such as product sales.
- Revenue by Customer and Month – Customer revenue trends month by month.
Using This Dashboard
The Dashboard helps you:
- Track revenue growth
- Monitor profitability
- Identify top-paying customers
- Compare monthly revenue trends
- Improve pricing and margins
- Focus on high-value customers
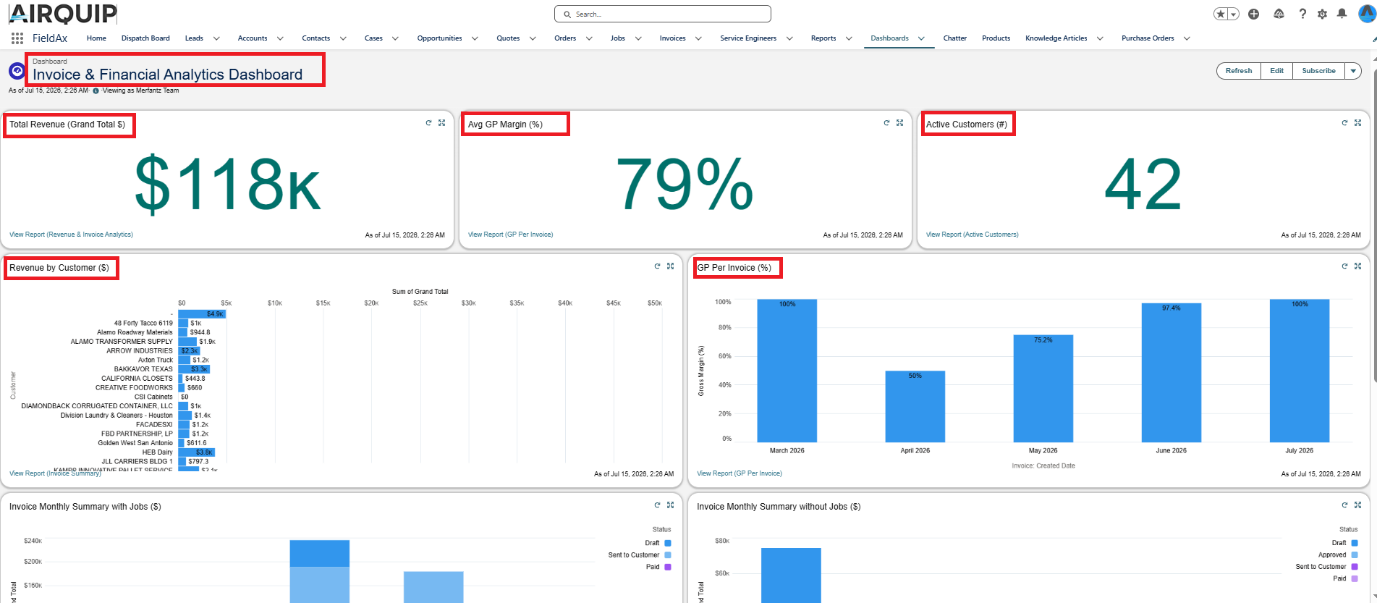
Invoice & Financial Analytics Dashboard.
Quick Reference
| Dashboard | Main Purpose |
|---|---|
| Customer Service & Account Analytics | Customer and service plan activity |
| Quote & Sales Performance | Quotes, sales, revenue, and profitability |
| Job & Service Operations | Jobs, technicians, time, and labor costs |
| Parts Demand & Operational Reporting | Parts usage, demand, and costs |
| Invoice & Financial Analytics | Revenue, invoices, and profitability |